
Getting started
To get started quickly, we'll walk you through the standard demo setup, which includes:
- A cluster of three
hydra-nodes, each directly connected to the others and configured with one of three Hydra credentials:Alice,Bob, orCarol - A single
cardano-nodeproducing blocks used as a (very fast) localdevnet - The
hydra-tuiexample for clients to interact with the individualhydra-node.
This tutorial uses Docker to install the nodes, so ensure Docker is installed. If you want to explore alternative ways of running the tools, see a variant of this tutorial or the testnet tutorial, which uses pre-built binaries. The documentation pages on installation and configuration provide more details.
Additionally, the hydra-tui uses the HTTP/WebSocket API provided by the hydra-node behind the scenes. The testnet tutorial will show how to use this API using low-level commands, or you can see the API reference for more details.
Video demonstration (a bit dated)
These instructions have been tested only on Linux environments (Ubuntu, NixOS). If you're on Windows or Mac OS X, you might need to adapt to use Volumes.
Preparation
All commands below are written as if executed from the demo folder in the project repository. Ensure you clone the repository, switch into the demo folder, and pull the latest Docker images:
git clone git@github.com:cardano-scaling/hydra.git
cd hydra/demo
docker compose pull
For convenience, we provide a script ./run-docker.sh, which combines all the following steps. It also performs a few sanity checks to prevent potential issues.
Set up the devnet
Next, prepare the devnet configuration to bootstrap a local Cardano blockchain. Note that we use a simplified variant of Cardano that does not require any stake pools.
./prepare-devnet.sh
Bring the Cardano node up with:
docker compose up -d cardano-node
Verify that the devnet is up-and-running by checking the logs with:
docker compose logs cardano-node -f
You should see traces containing TraceAdoptedBlock, which means that the devnet is producing blocks .. nice!
Do not wait too long between these two commands. If you get TraceNoLedgerView errors from the Cardano node, the genesis start time is too far in the past, and you need to update them by running prepare-devnet.sh again.
You can use jq to follow the logs and see the node update kinds with the following command:
docker compose logs -f --no-log-prefix cardano-node | jq -Rr 'fromjson? | .data.kind'
Next, we need to give Alice, Bob, and Carol some UTXOs to deposit into the head and ada for paying fees. To do this, use the seed-devnet.sh script, which uses the cardano-cli within the already running cardano-node container:
./seed-devnet.sh
Start Hydra nodes
Finally, now that the on-chain preparations are done, we can bring the Hydra network (all three nodes for Alice, Bob, and Carol) up by running:
docker compose up -d hydra-node-{1,2,3}
Using compose, you can start the demo Terminal-based User Interface (hydra-tui) to interact with Hydra nodes. There are three preconfigured TUI services in the compose definition: hydra-tui-1, hydra-tui-2, and hydra-tui-3. To connect to the first Hydra node in a terminal, run the following command:
docker compose run hydra-tui-1
This will start a full-blown terminal interface loaded with signing keys corresponding to the first Hydra node. In other terminals, you can start other nodes in a similar fashion targeting hydra-tui-2 and hydra-tui-3 services.
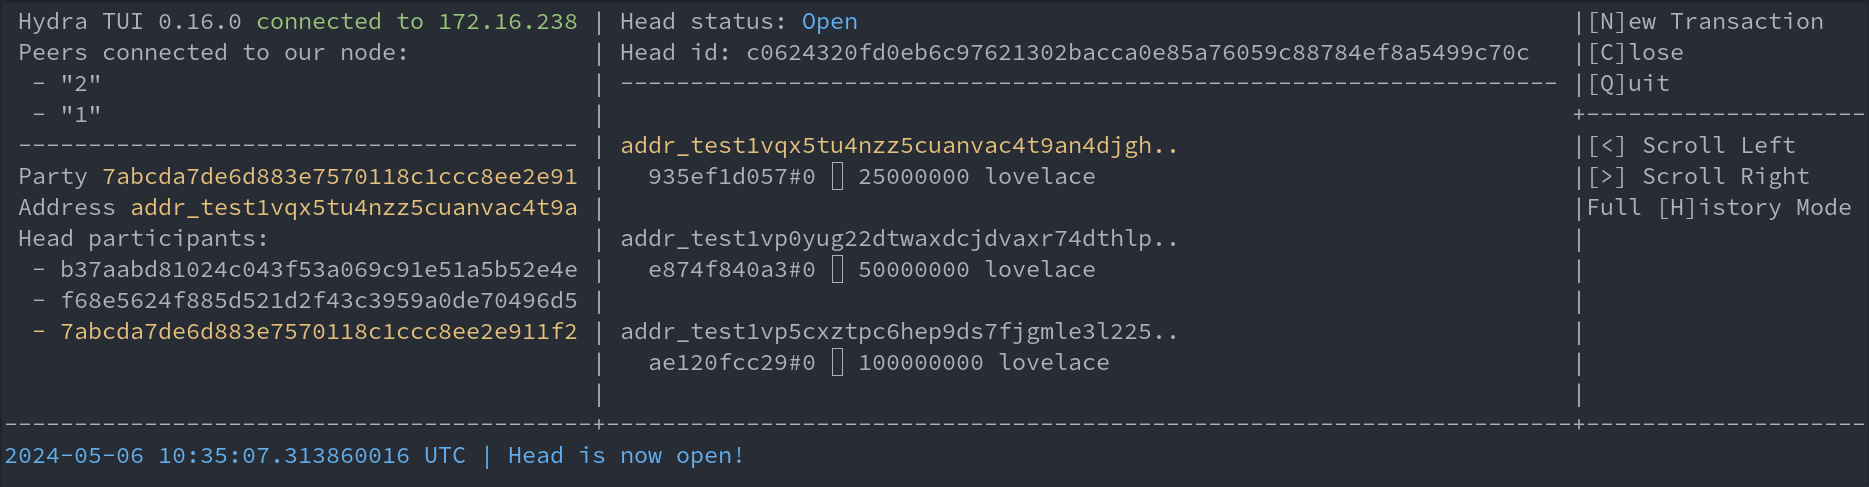
Use the head
Using the terminal interface of any node, you can now [i]nit the Hydra head. The head opens immediately — there is no commit phase. To add funds, use [c]ommit to deposit pre-distributed UTXOs into the open head. Note that these steps are near-instant as the devnet is producing blocks much faster than a public testnet or the mainnet. You can also use the hydra-tui or the API to create new transactions and submit them to the Hydra head.
Monitoring
We provide a minimal monitoring setup using Prometheus and Grafana to give you insight into the node's activity, including snapshot processing and peer connectivity.
This setup focuses solely on the metrics exposed by the Hydra nodes and does not cover system-level metrics like CPU, memory, disk, or network usage.
Hydra nodes expose Prometheus-compliant metrics through an HTTP server, available on the standard /metrics endpoint.
Reference the Operating Hydra nodes guide for a more in-depth explanation on available metrics.
Start the monitoring stack
Bring up Prometheus and Grafana:
docker compose up -d prometheus grafana
Prometheus will scrape the /metrics endpoint of each Hydra node automatically.
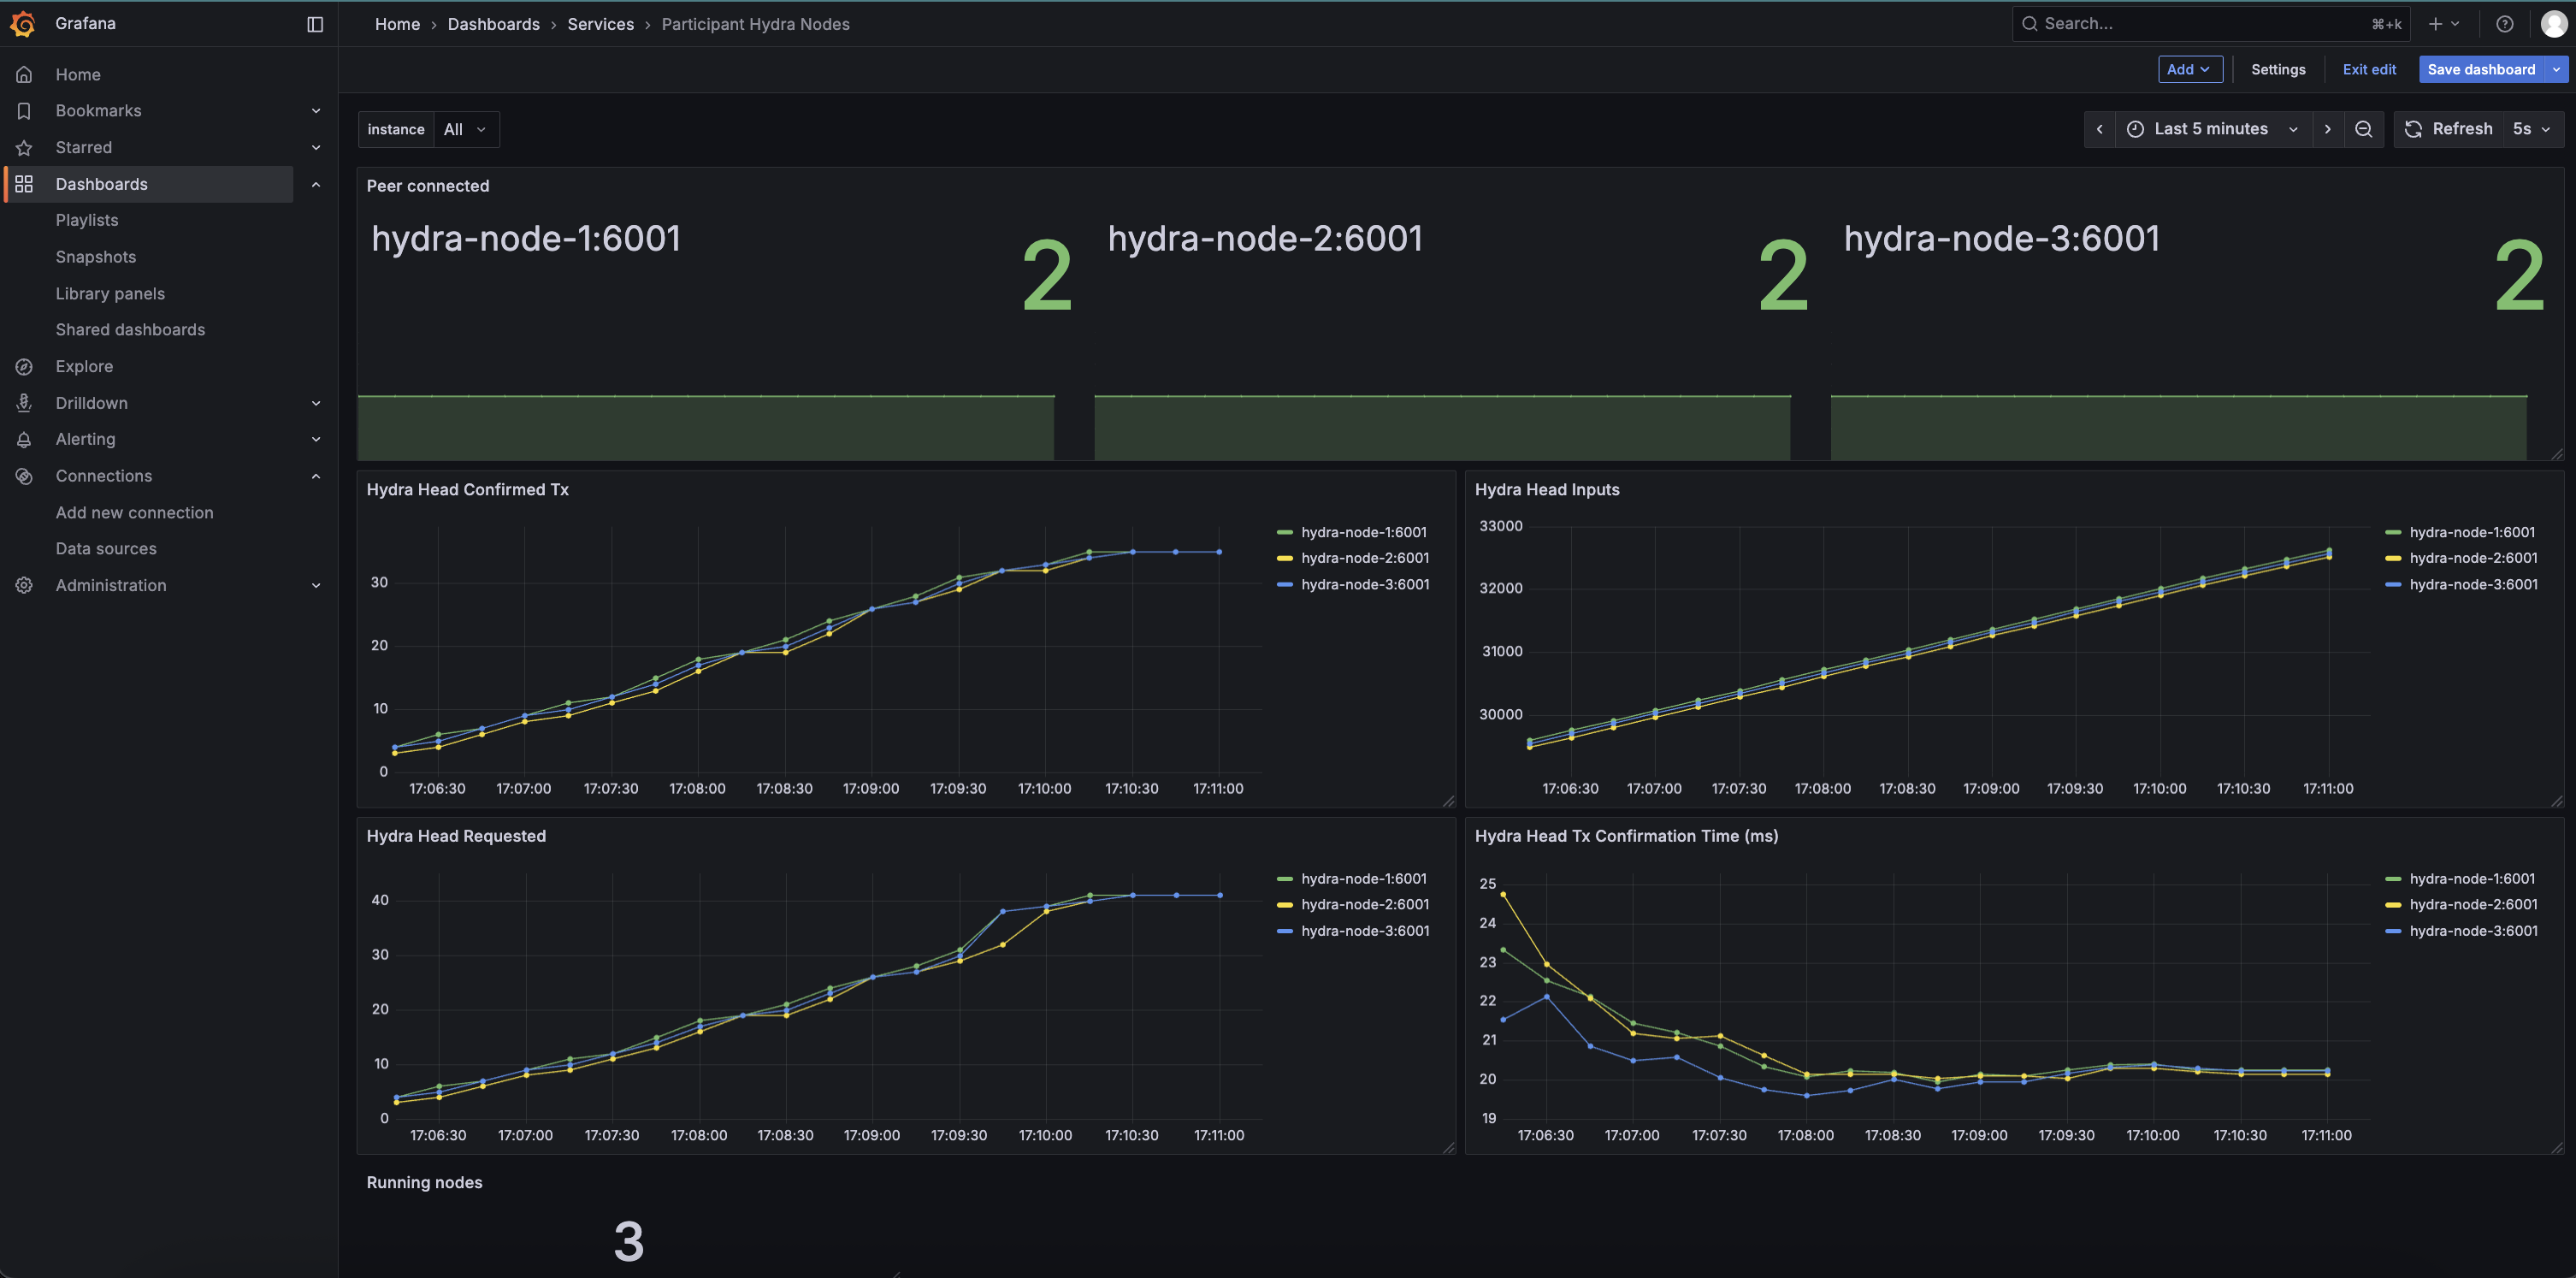
Grafana is preconfigured with a minimal dashboard visualizing key metrics from each node:
| Panel | Metric | Description |
|---|---|---|
| Hydra Head Confirmed Tx | hydra_head_confirmed_tx | Number of snapshots confirmed by the Hydra head |
| Hydra Head Inputs | hydra_head_inputs | Number of inputs processed by the head |
| Hydra Head Tx Confirmation Time (ms) | hydra_head_tx_confirmation_time_ms | Average time taken to confirm snapshots on the Hydra head (from request to confirmation) |
| Peer Connected | hydra_head_peers_connected | Number of peers each node is currently connected to |
| Hydra Head Requested | hydra_head_requested_tx | Number of requested transactions received by the node (incoming ReqTx messages) |
Using Grafana
- Open Grafana in your browser at
http://localhost:3000. - Default login credentials are
admin/admin. - Explore the preconfigured dashboard or create your own panels using Prometheus queries.
- Use the top-left
instancedropdown to inspect metrics per Hydra node. - Hover on any graph or stat panel to see per-node values in real time.
Dashboard Preview